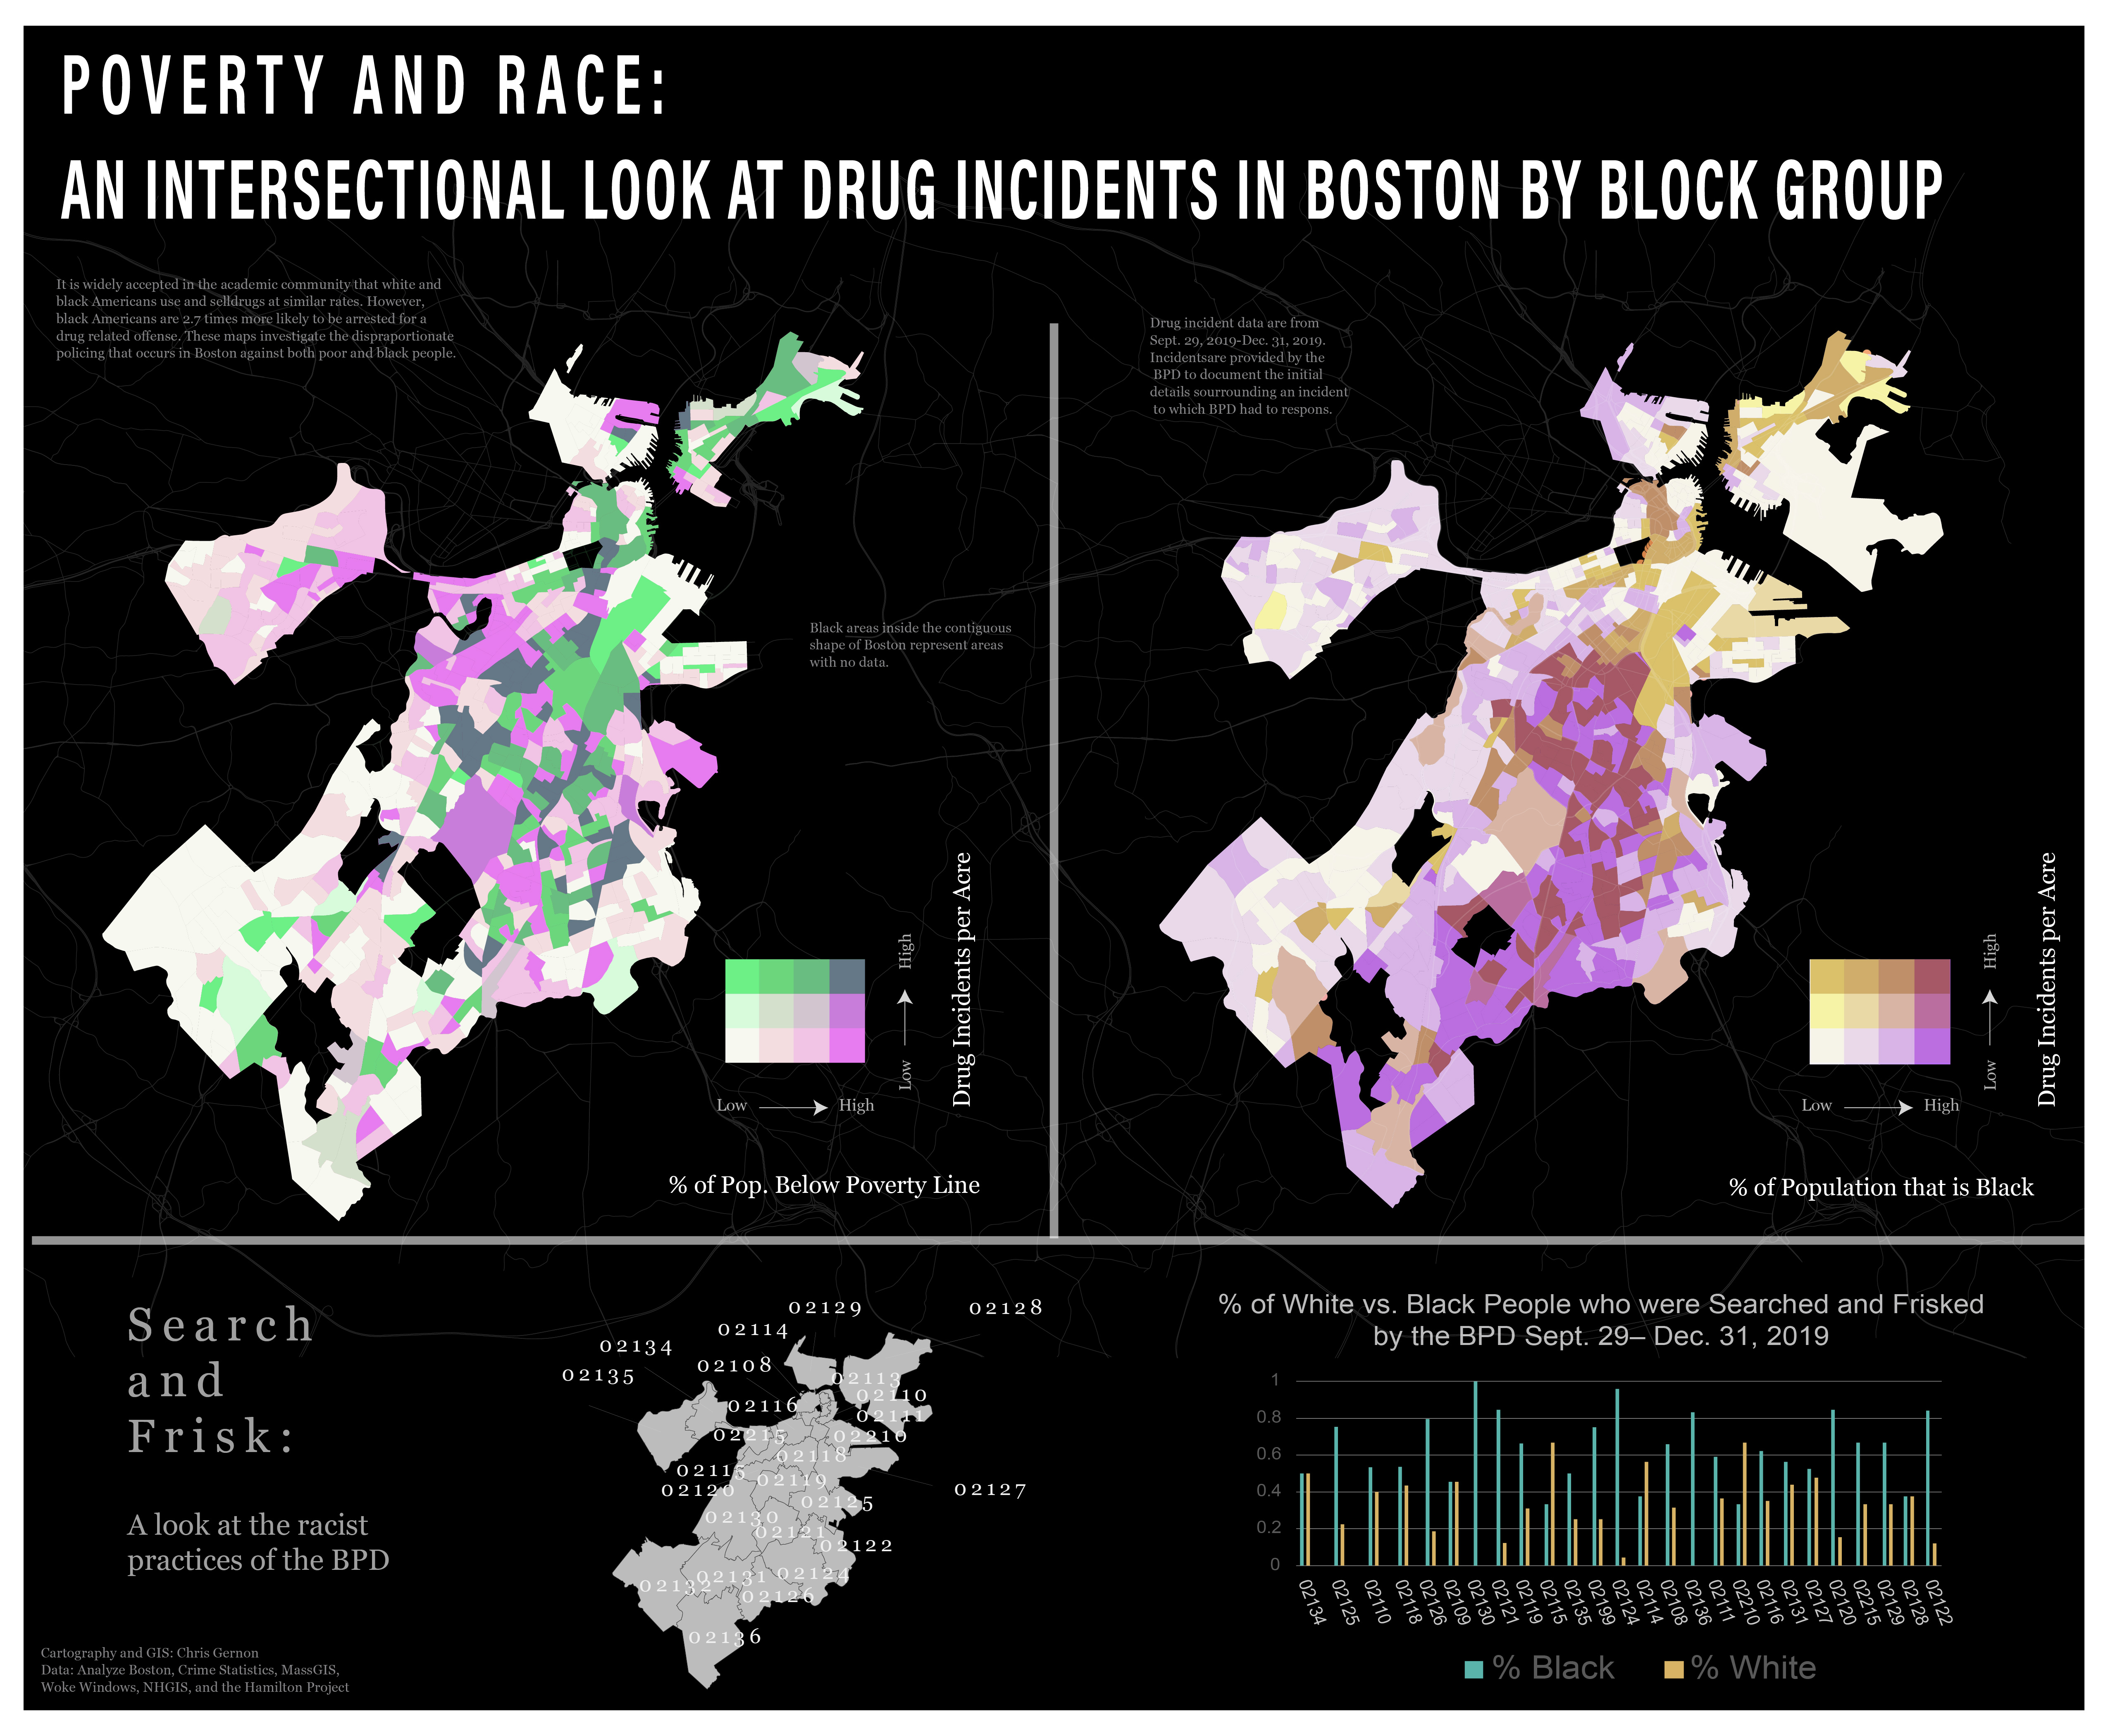
Poverty, Race, and Policing in Boston, MA
Boston has a tulmutous urban planning history. It is an incredibly segregated city. This graphic investigates the intersection of class and race in relation to drug and search and frisk incidents. Please see the final product here.
GEOG 323, Fall 2019
Computer skills used: QGIS, R, Adobe Illustrator
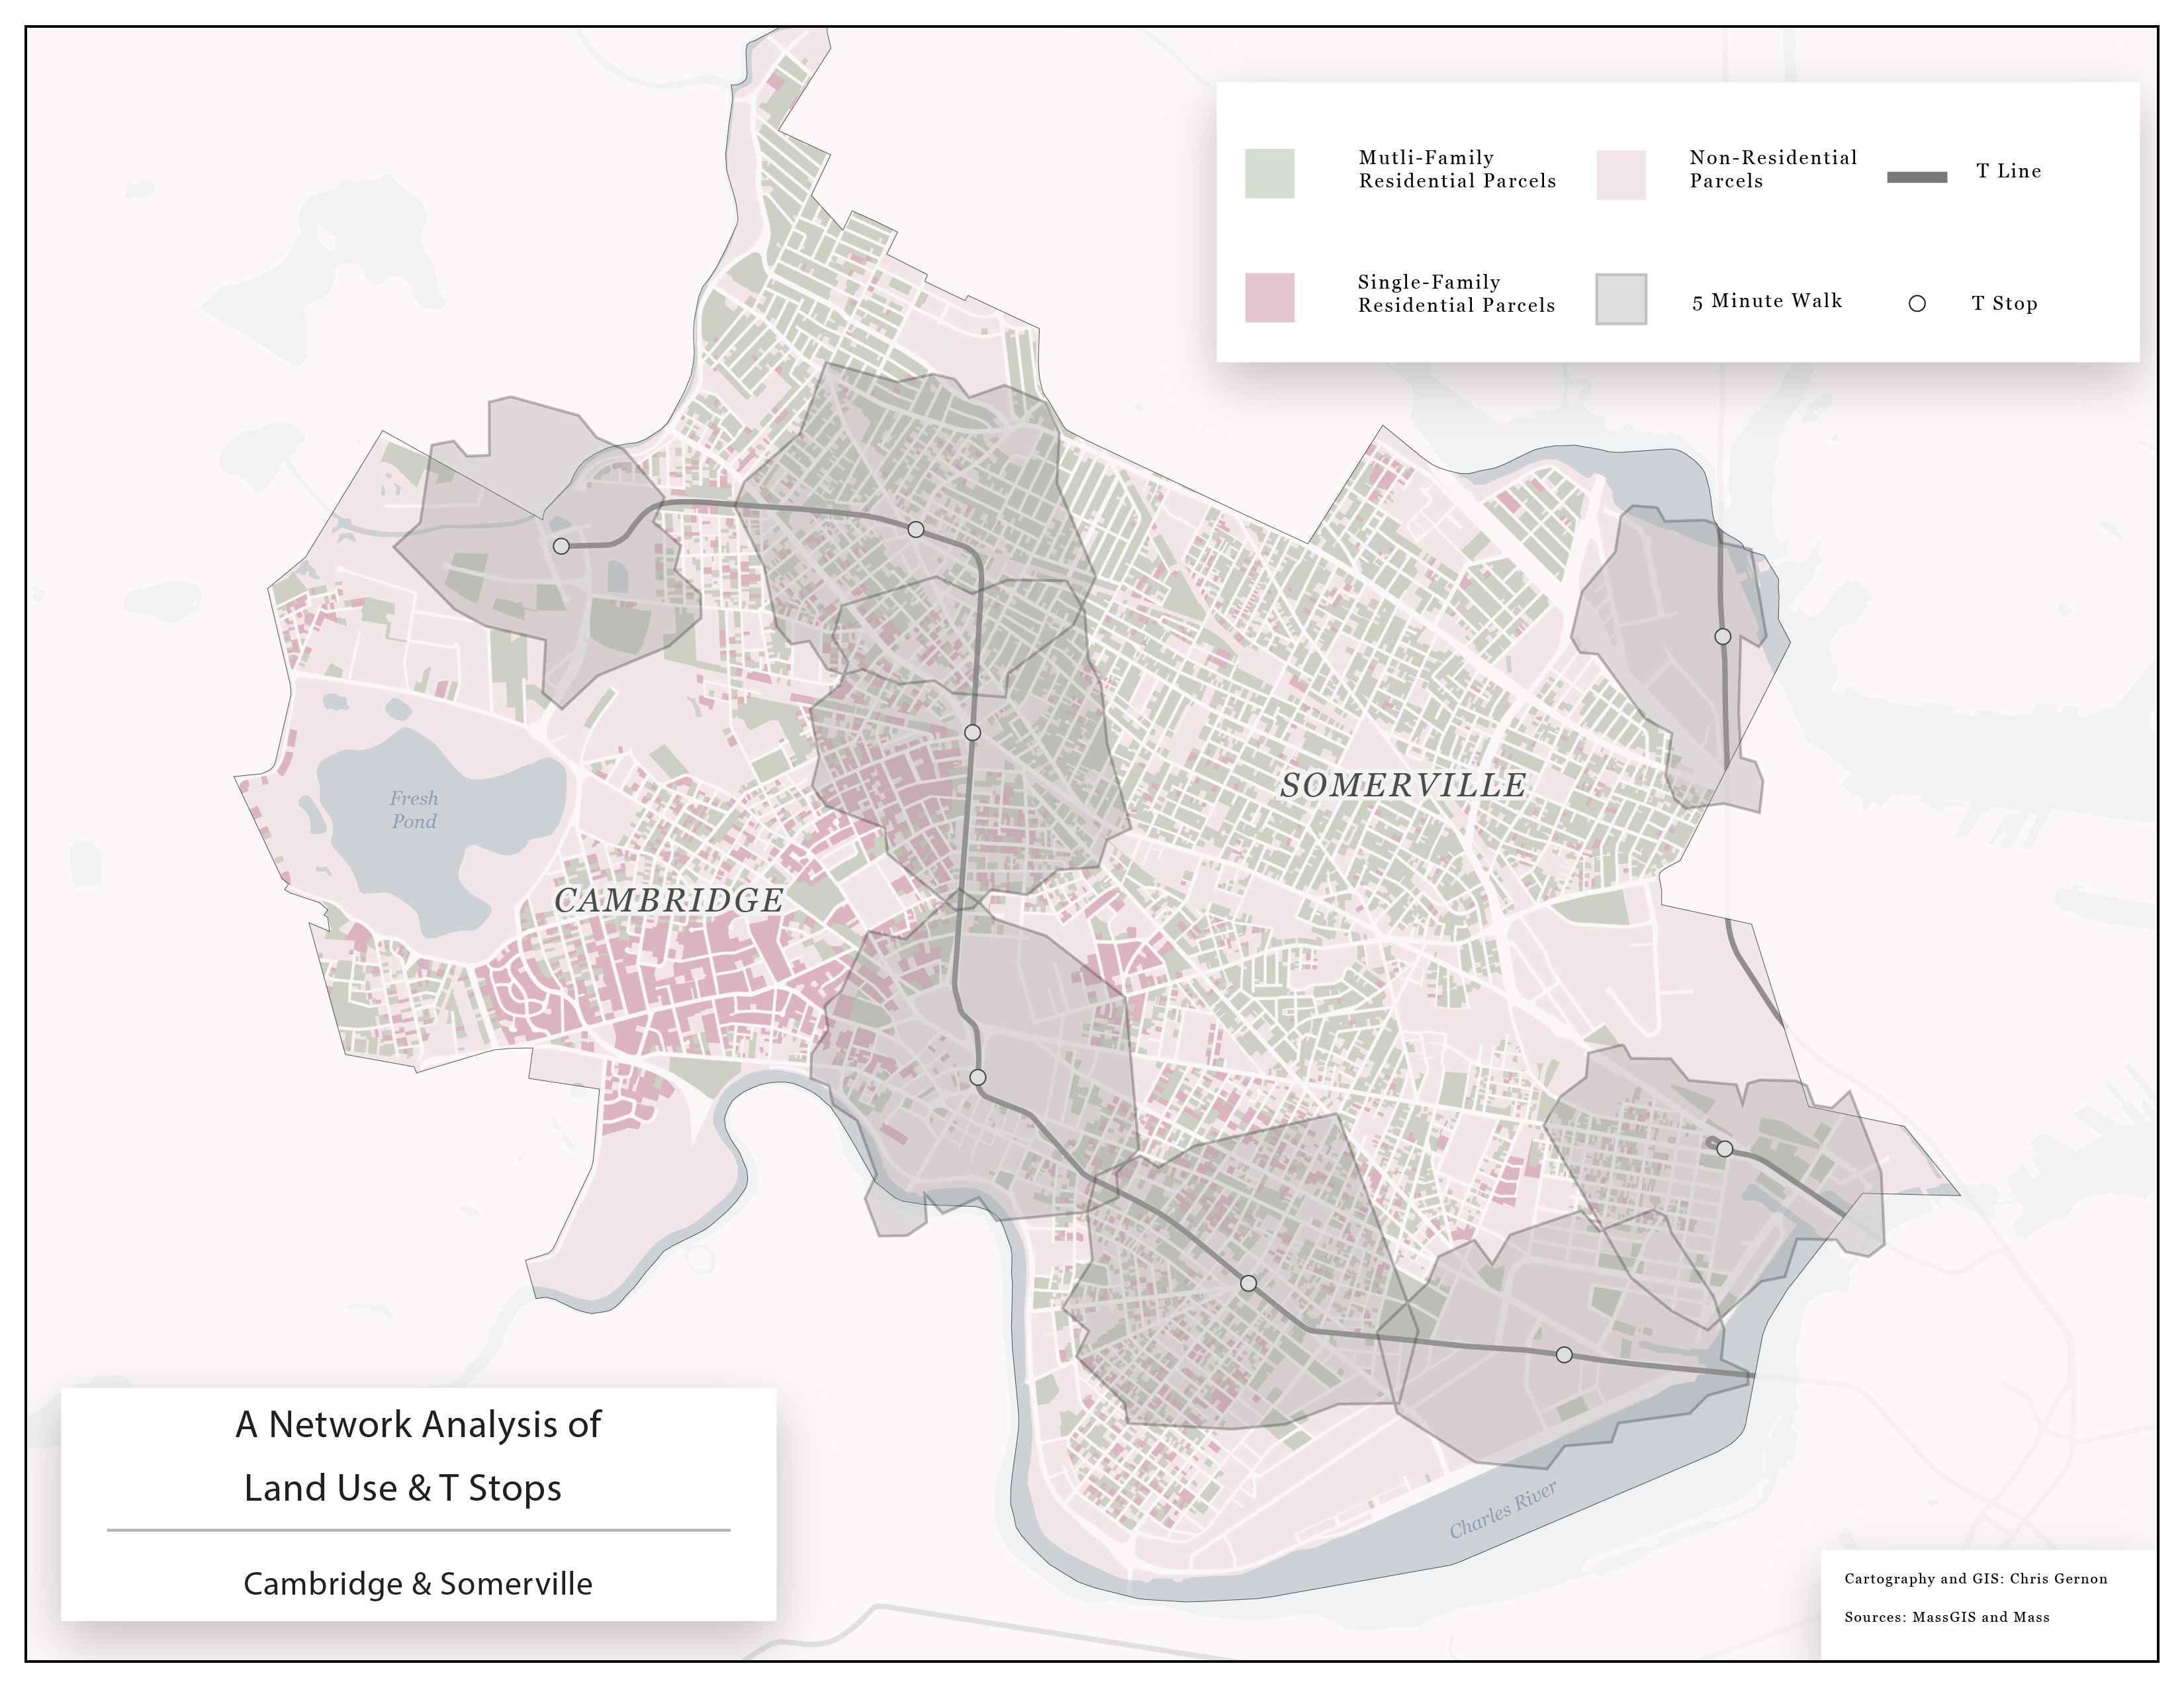
Land Use and Network Analysis in Massachusetts
This map investigates the land use within a 5 minute walk of T stops in Cambridge and Somerville. Please see the final product here.
GEOG 323, Fall 2019
Computer skills used: QGIS, Adobe Illustrator
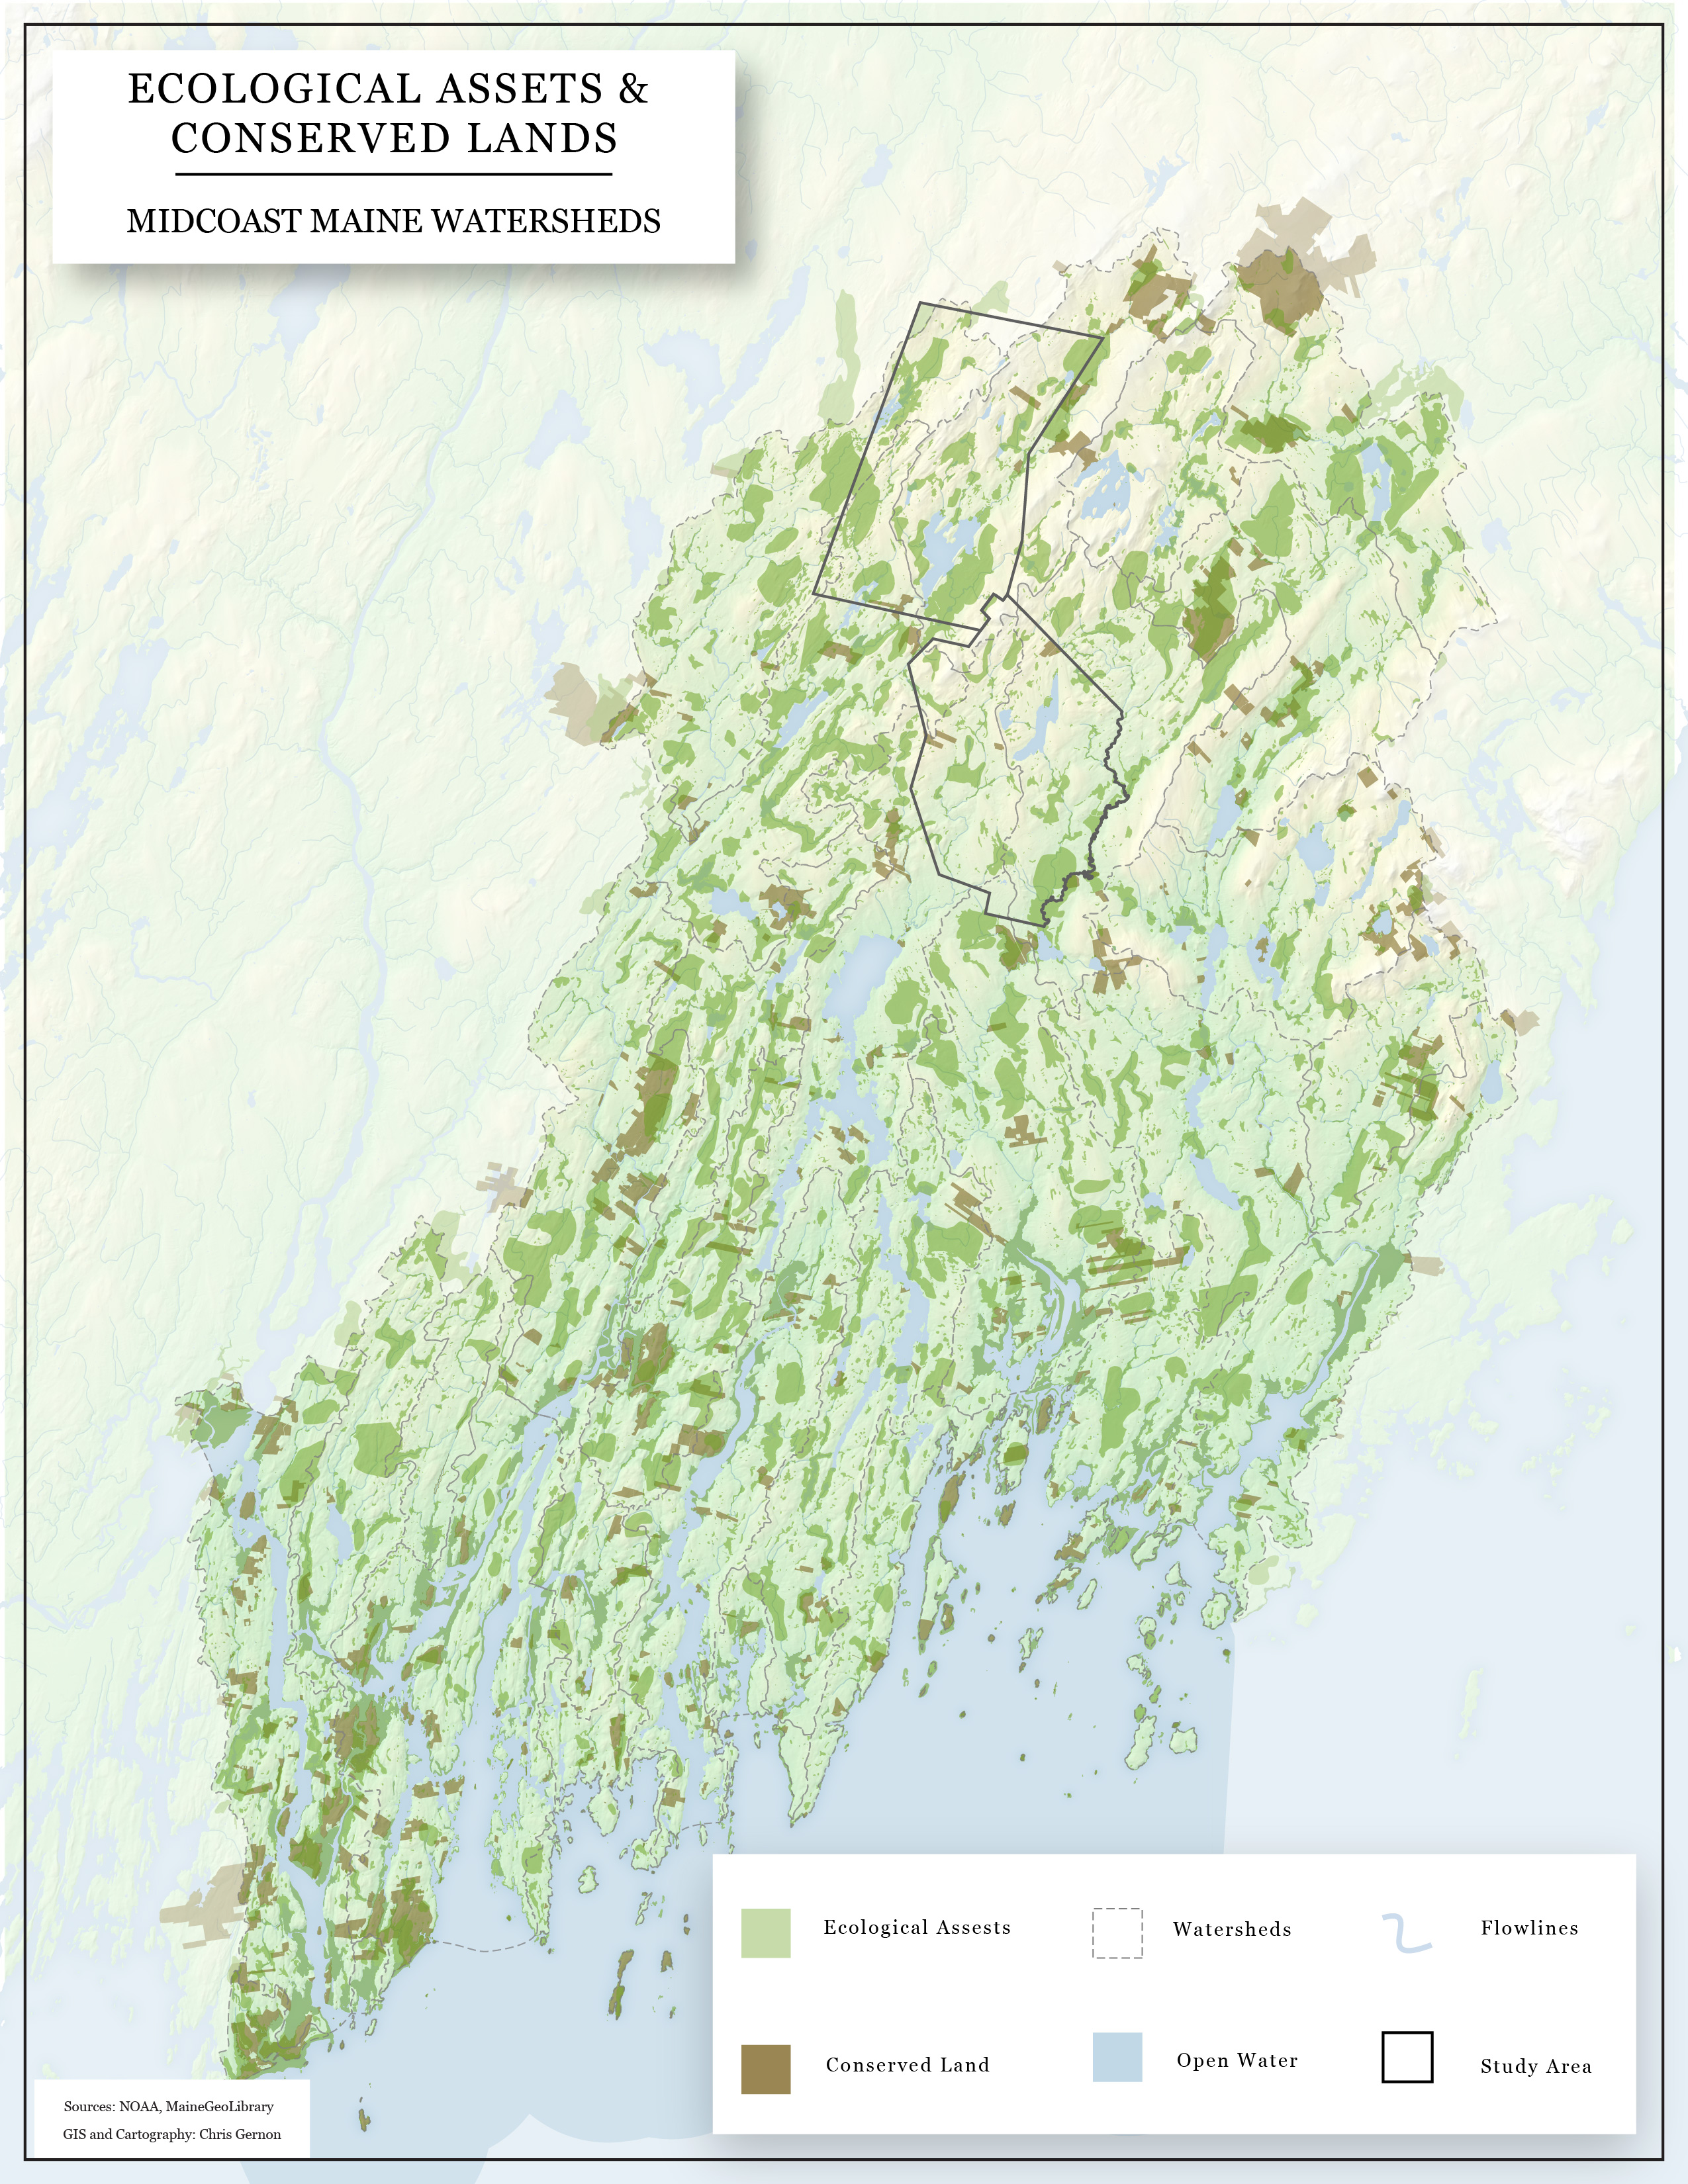
Ecological Assets & Conserved Lands in Maine's Mid-Coast Watersheds
This map investigates the prevalance of ecological assets and conserved lands in Maine's Mid-Coast Watershed. It is one part of a two part analysis that recommends where Maine could focus resources for conservation and preservation. Part two examines the landcover in the study region (find it here) Please see the final product here.
GEOG 1026, Winter 2021
Computer skills used: QGIS, Adobe Illustrator
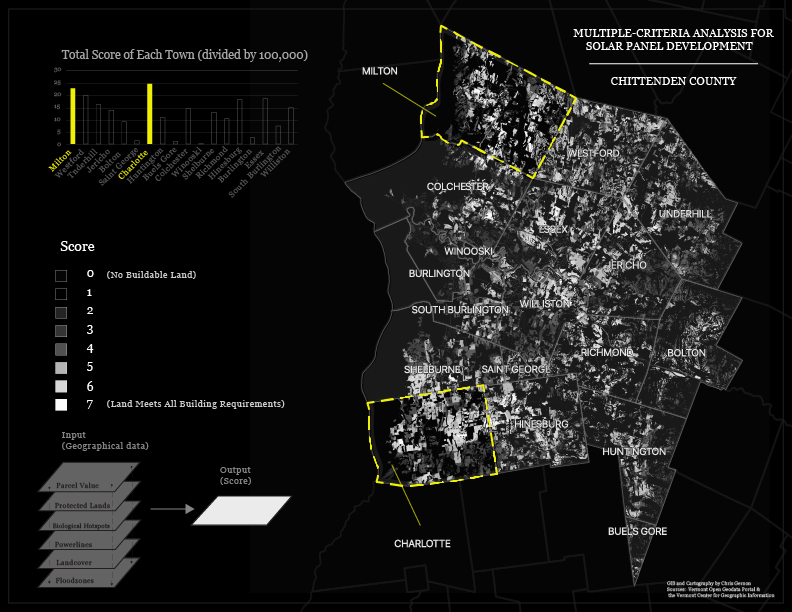
Multiple-criteria Analysis for Solar Panel Development in Chittenden County, VT
This map uses a multiple-criteria analysis to optimize the construction of solar panels in Chittenden County. The analysis takes into account parcel value, biological hotspots, powerline access, landcover, floodzones, and protected lands. Please see the final product here.
GEOG 1026, Winter 2021
Computer skills used: QGIS, Adobe Illustrator
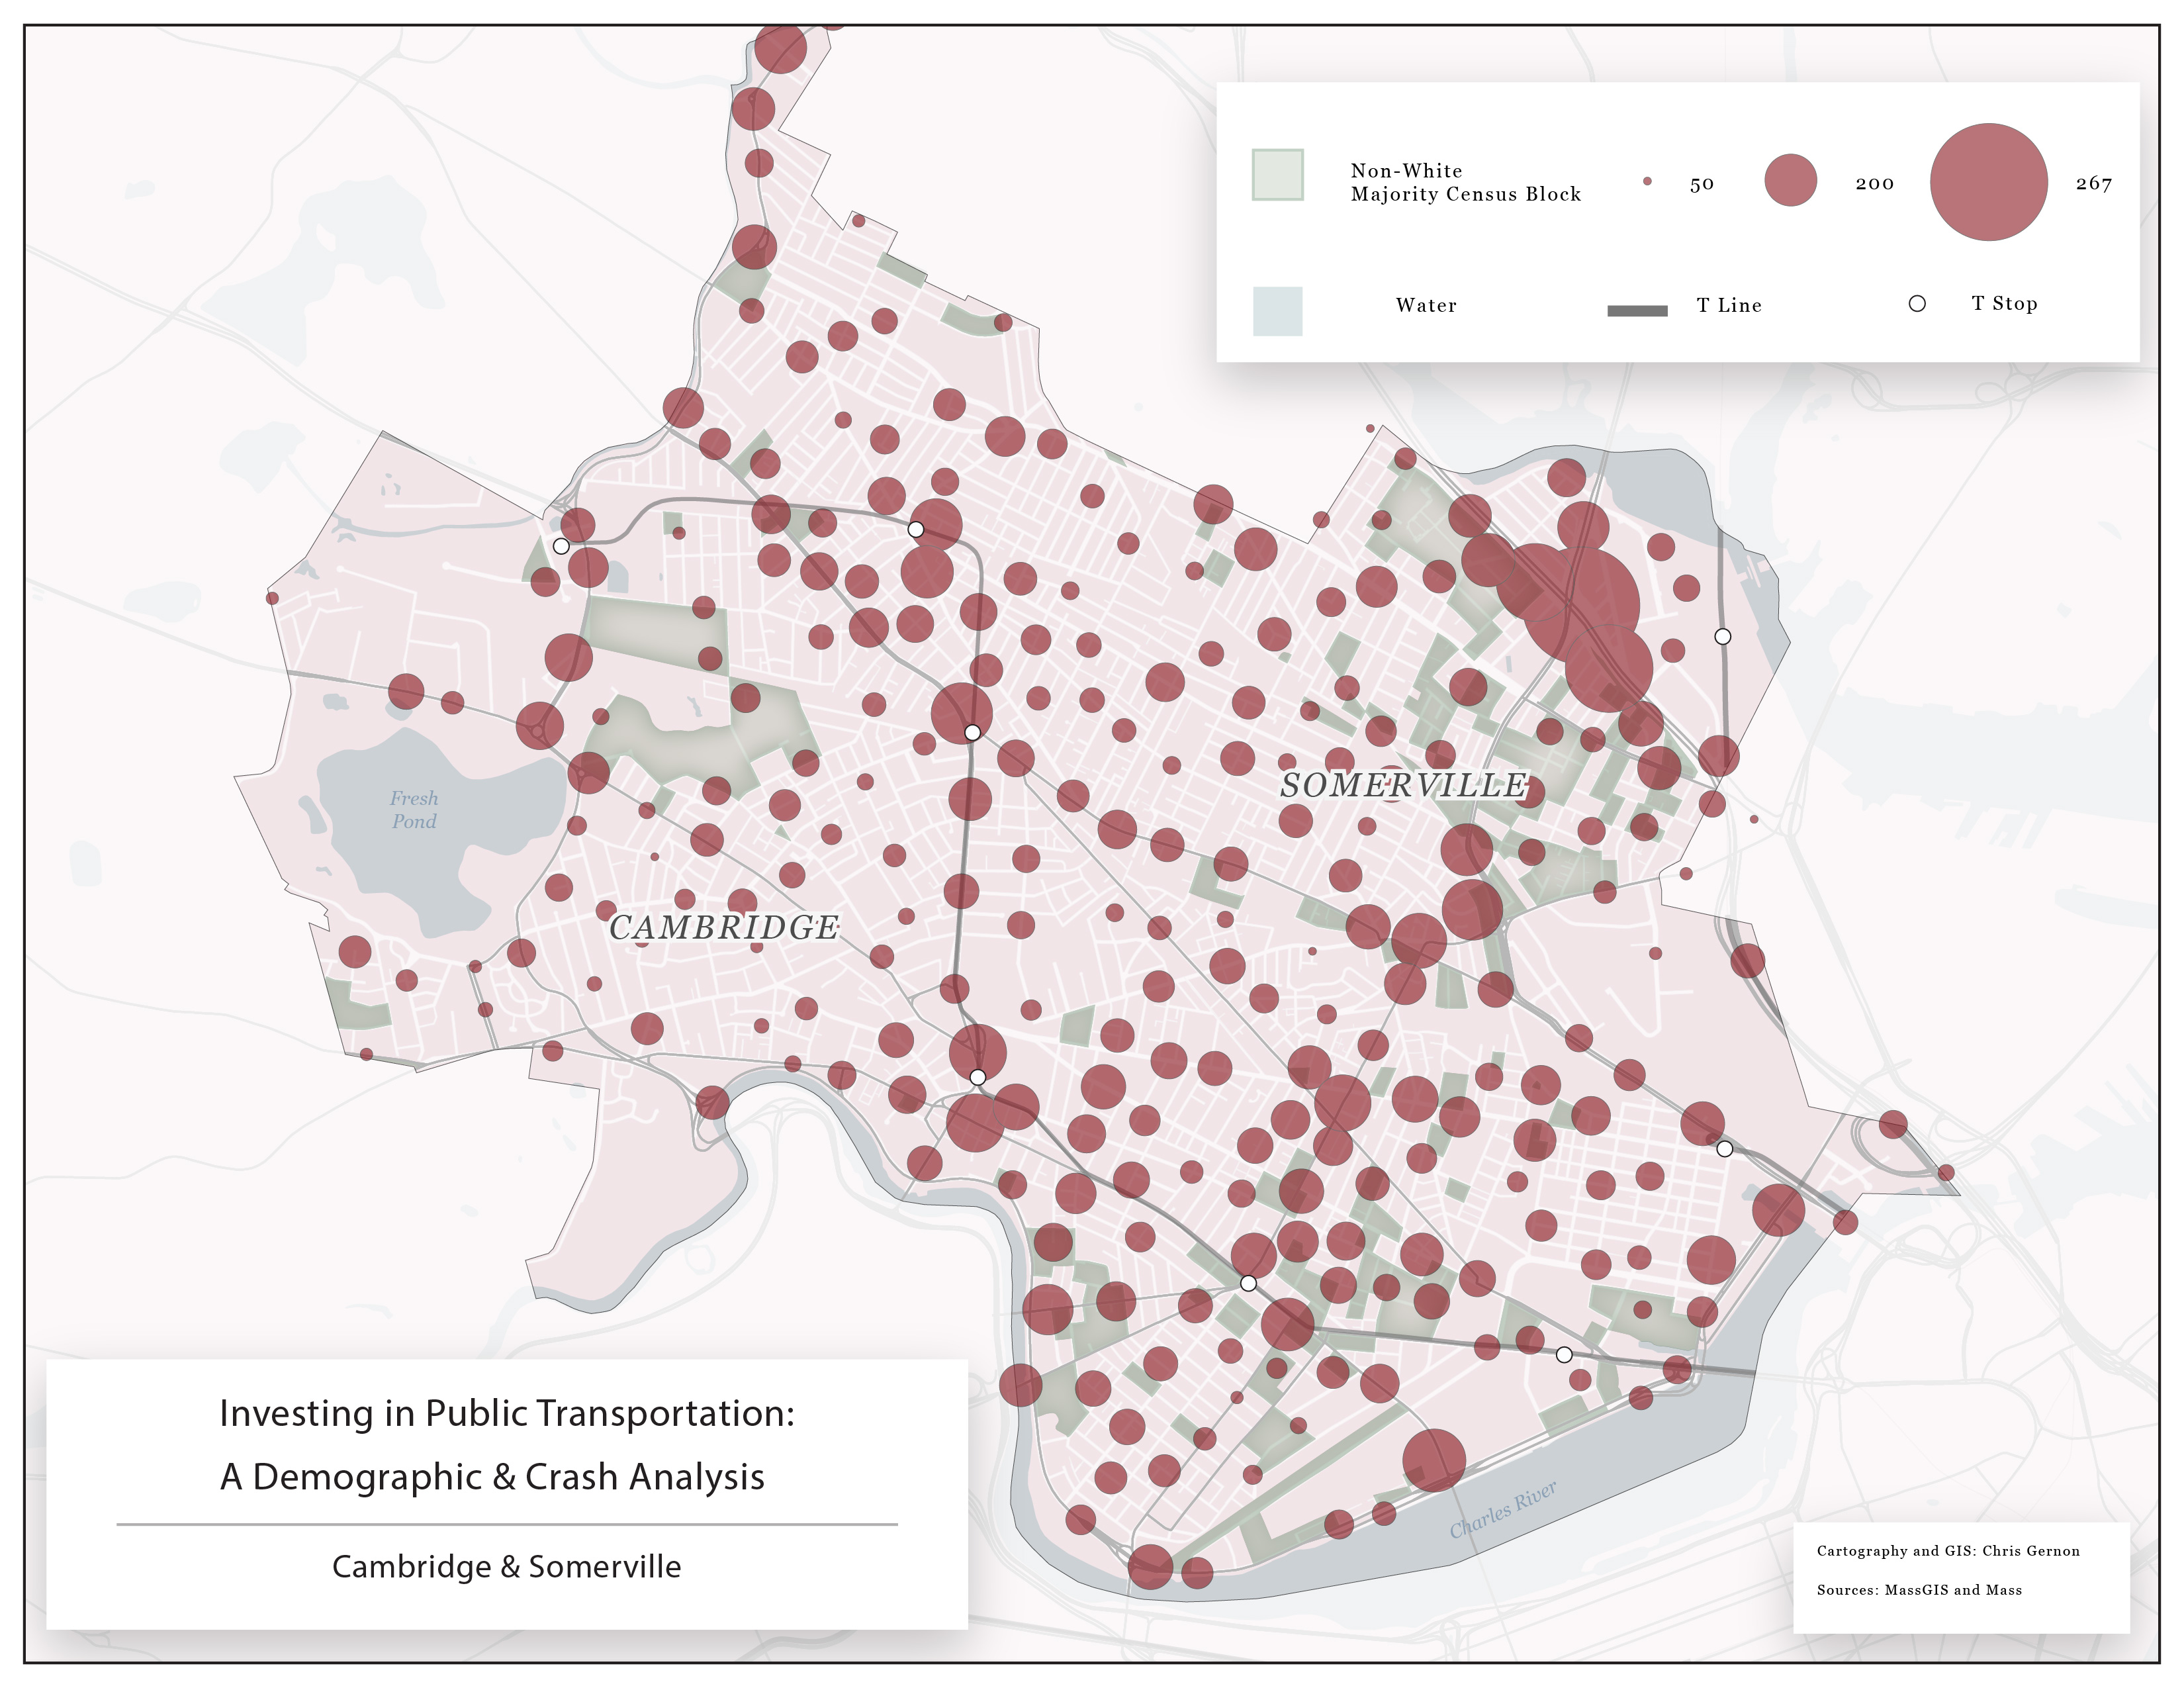
Land Use and Network Analysis in Massachusetts
This map investigates the land use within a 5 minute walk of T stops in Cambridge and Somerville. Please see the final product here.
GEOG 1026, Winter 2021
Computer skills used: QGIS, Adobe Illustrator
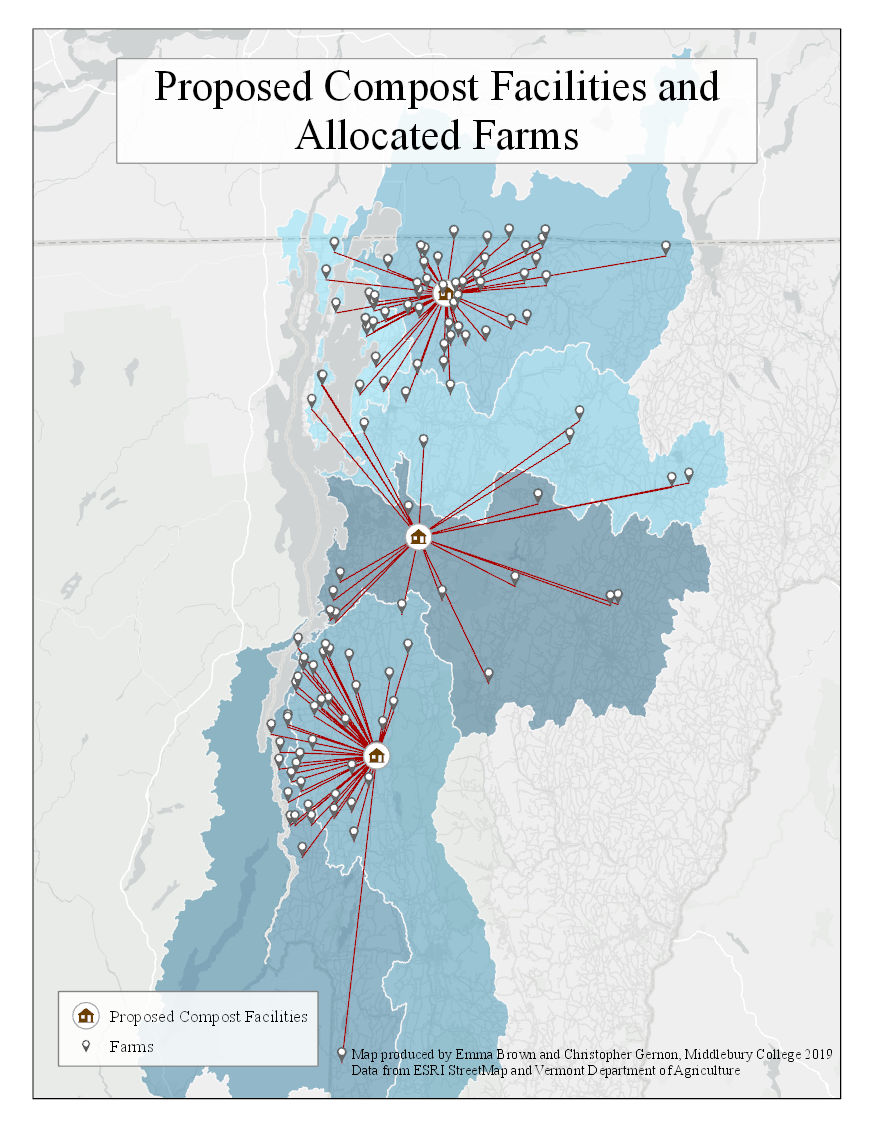
Compost Facility Proposal in Vermont
This map came out of a consultation with Digested Organics, a Michigan based company that was interested in constructing an anaerobic digester in Vermont's Champlain Valley. The goal of the project was to locate a potential area of construction that optimizes driving time to all local dairy farms in the area. Click here here for an overview map. Click for a closer look at hub 1, hub 2, and hub 3.
Independent Study, Winter 2018
Computer skills used: ArcGIS Pro
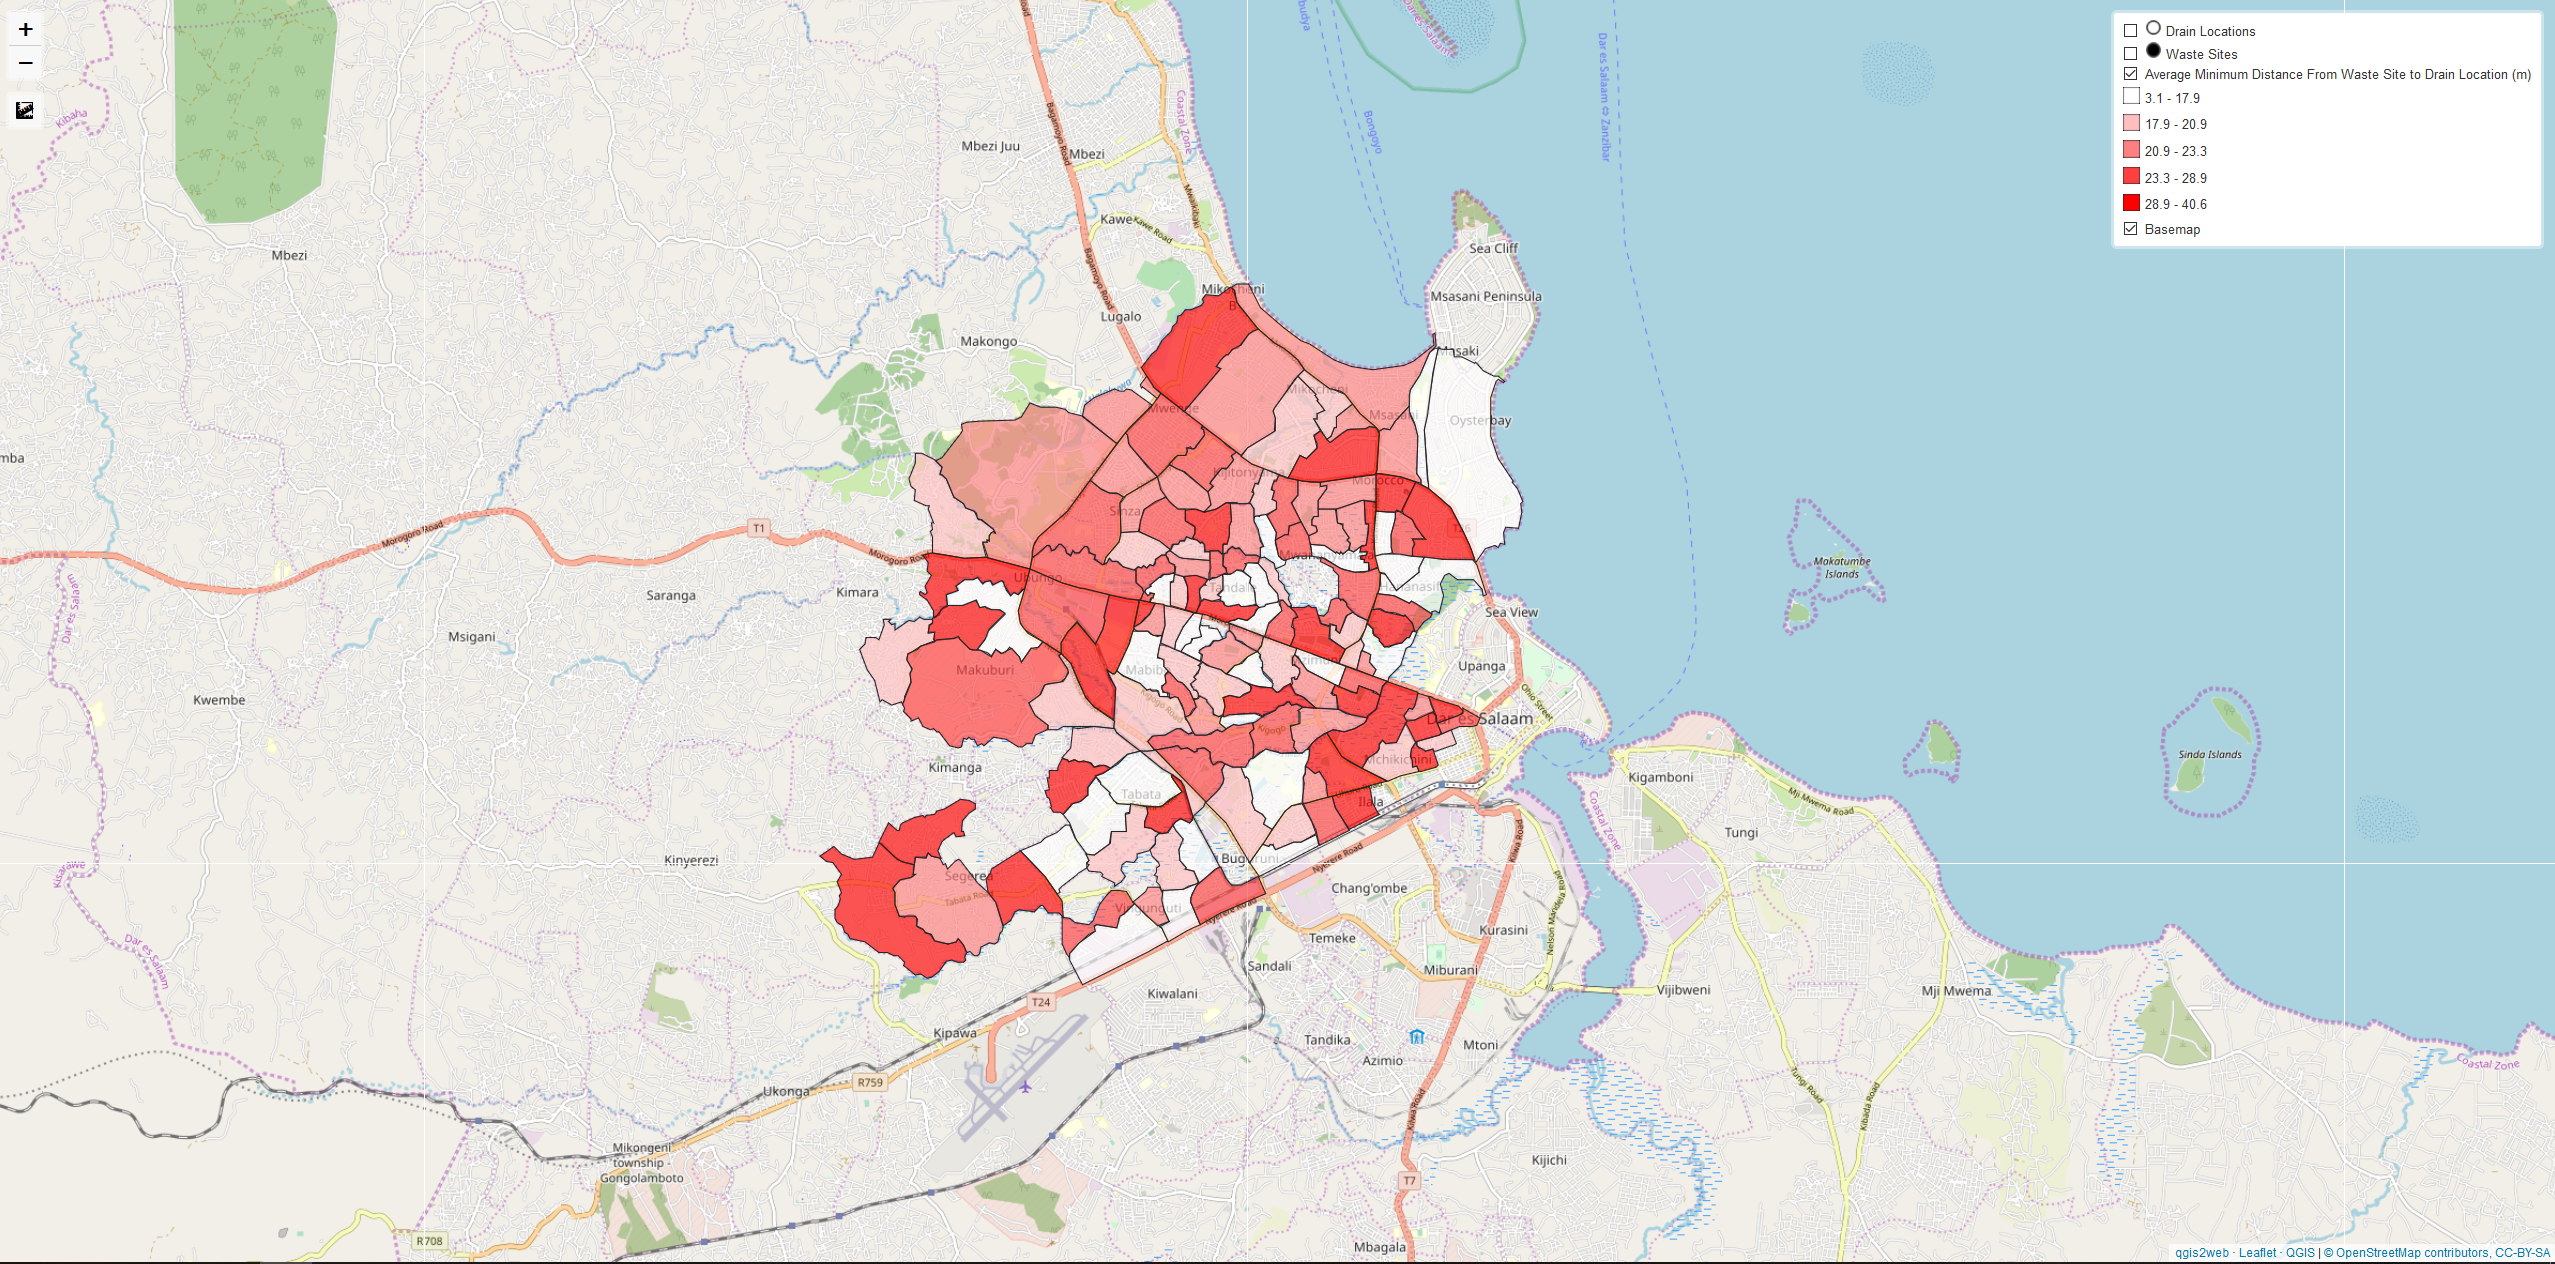
Analyzing Resilience in Dar Es Salaam using OSM
Dar Es Salaam is a city that is uniquely susceptible to floodings. I was interested in finding the minumum average distance of waste sites to drain locations in order to determine which subwards are likely to experience blocked drains duing a flood. Please see the final product here.
GEOG 323, Fall 2019
Computer skills used: SQL, Batchscript processing, PostGIS, , OSM2PGSQL, Leaflet, Javascript, QGIS, Open Street Map
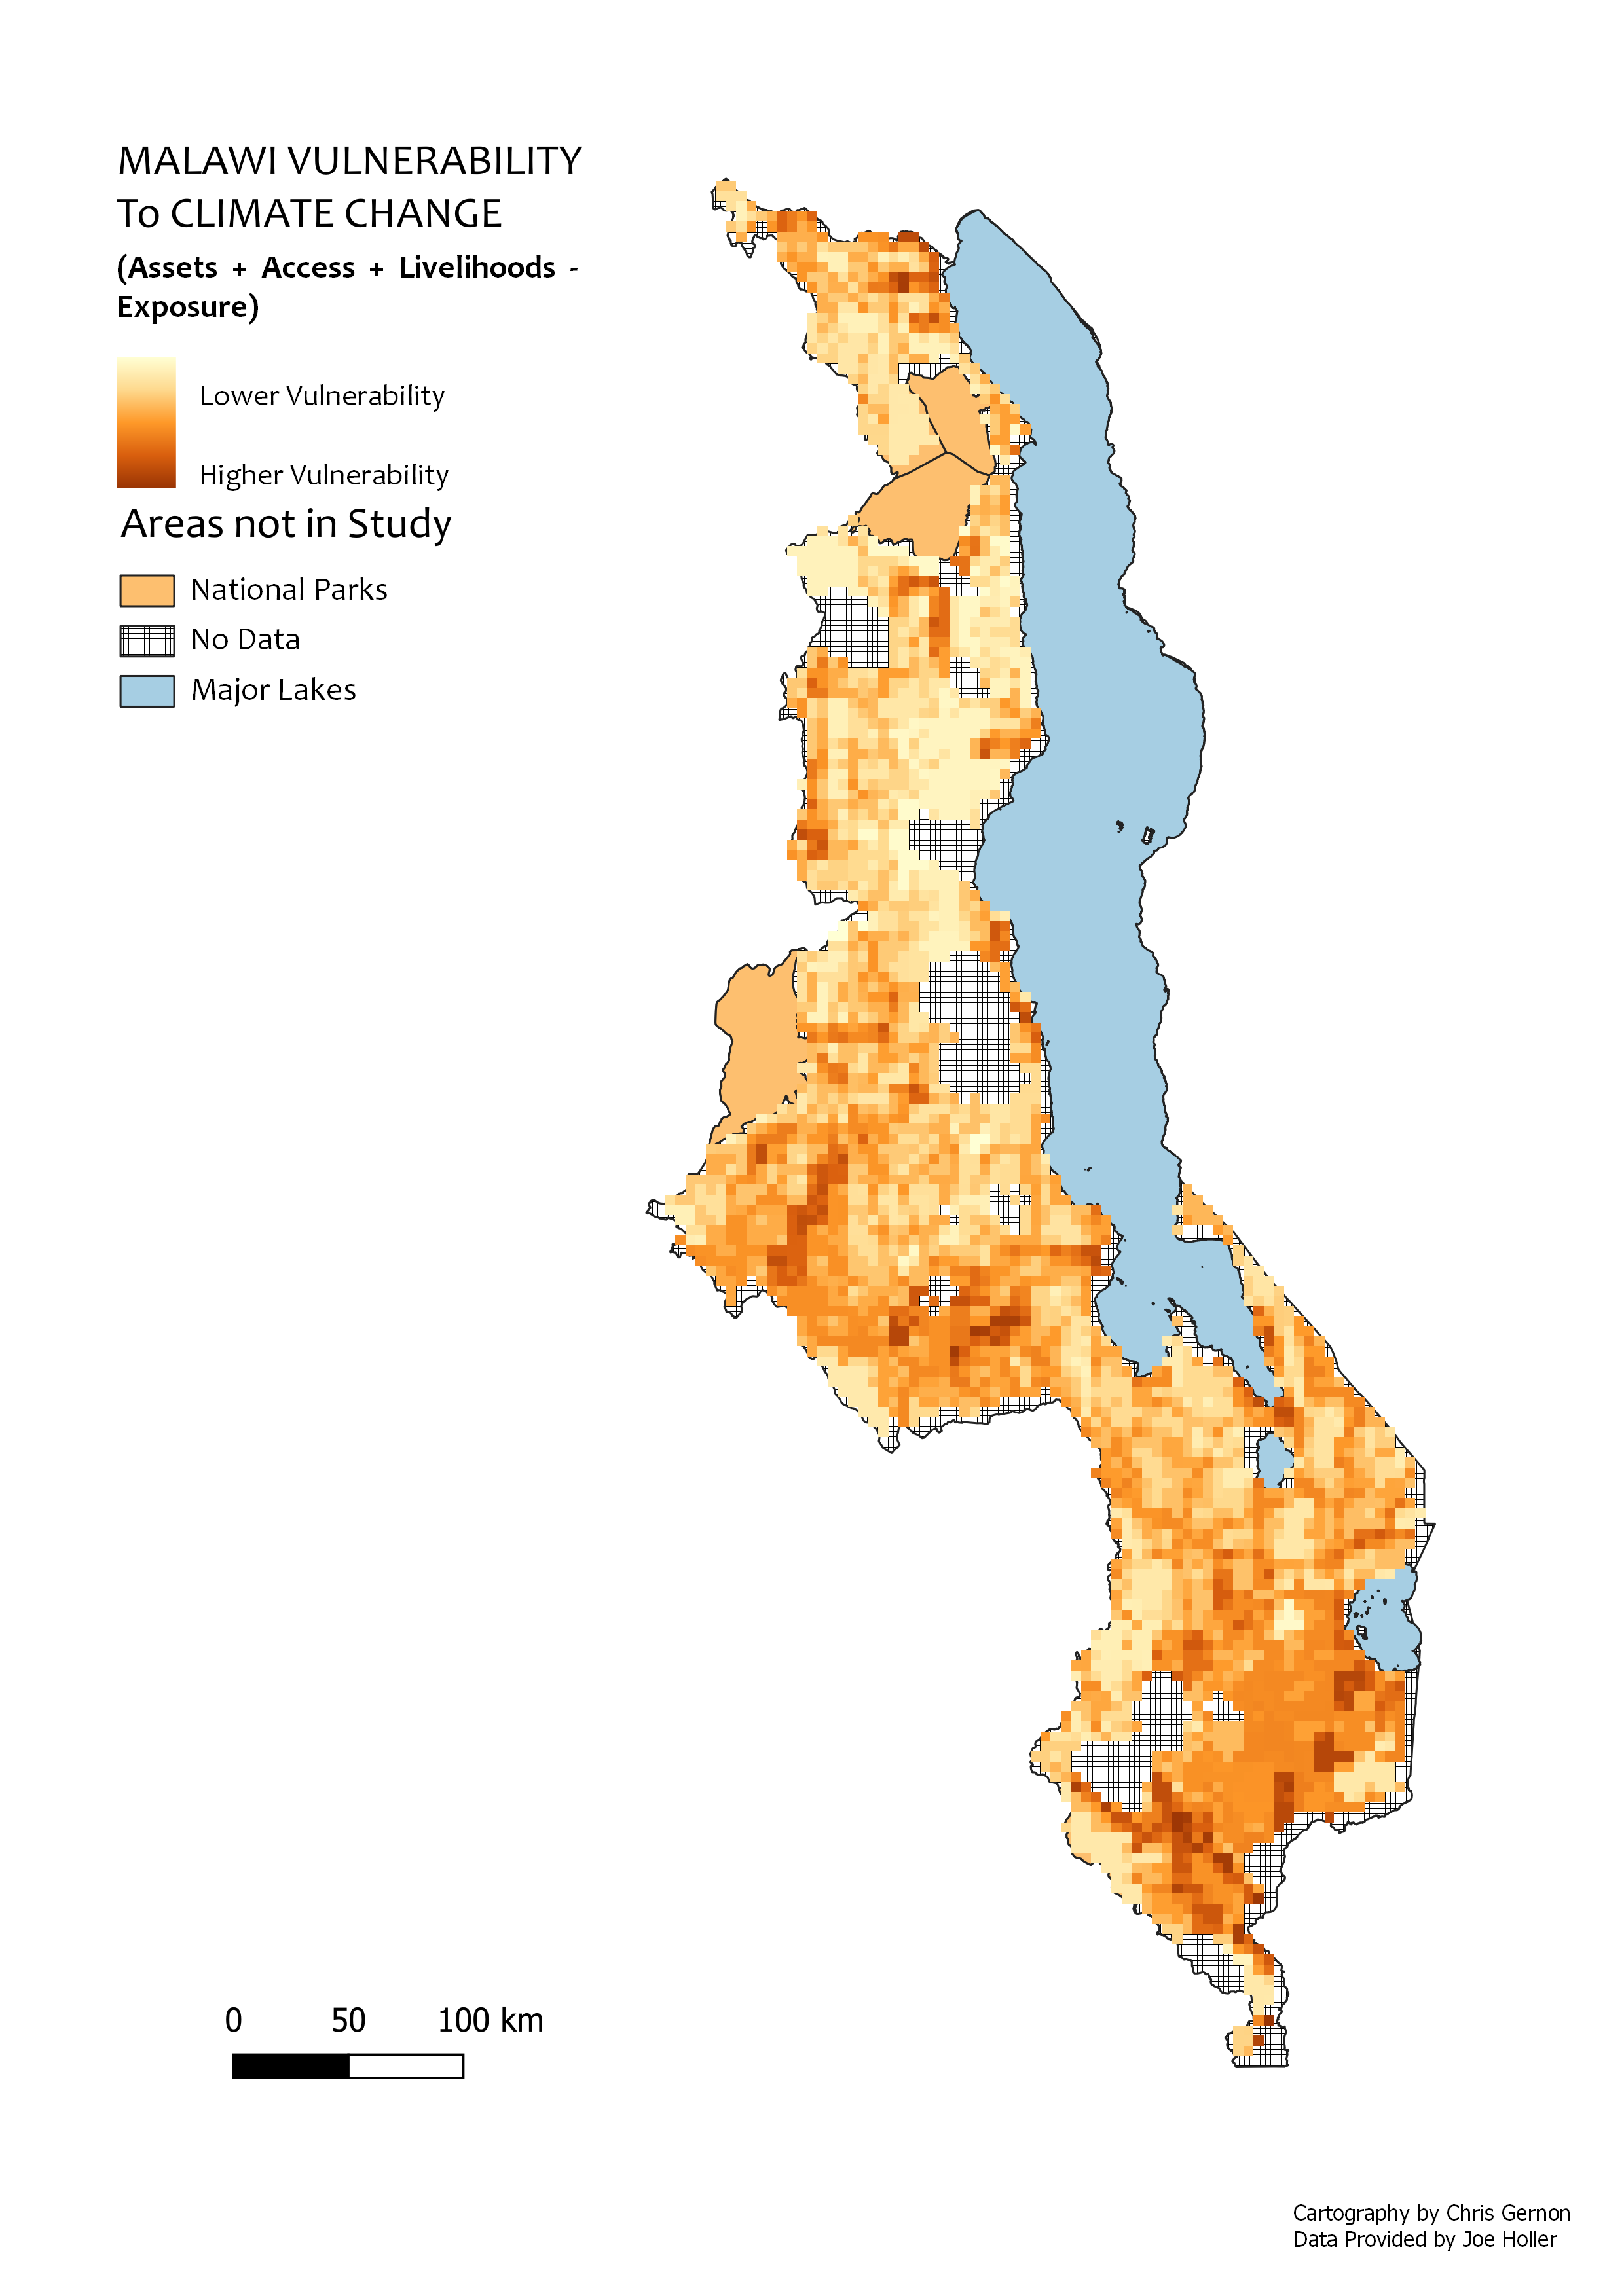
Multi-criteria Analysis of Hazard Vulnerability in Malawi
The goal of this analysis was to attempt to reproduce the methodology and results of a paper titled, "Vulnerability modeling for sub-Saharan Africa: An operationalized approach in Malawi.” The purpose of this analysis was to (1) learn how to use a methodology to reproduce a previous workflow (2) learn how to perform a multi-criteria analysis (3) expose the issue of reproducibility and transparency in academic work, particularly related to GIS. Because the paper had an unclear data collection methodology and an unclear GIS workflow, I was unable to accurately reproduce the map in the paper; however, both maps had higher degrees of vulnerability in the Northeastern, Southeastern, and Western Central parts of Malawi.
GEOG 323, Fall 2019
Computer skills used: PostGIS, QGIS
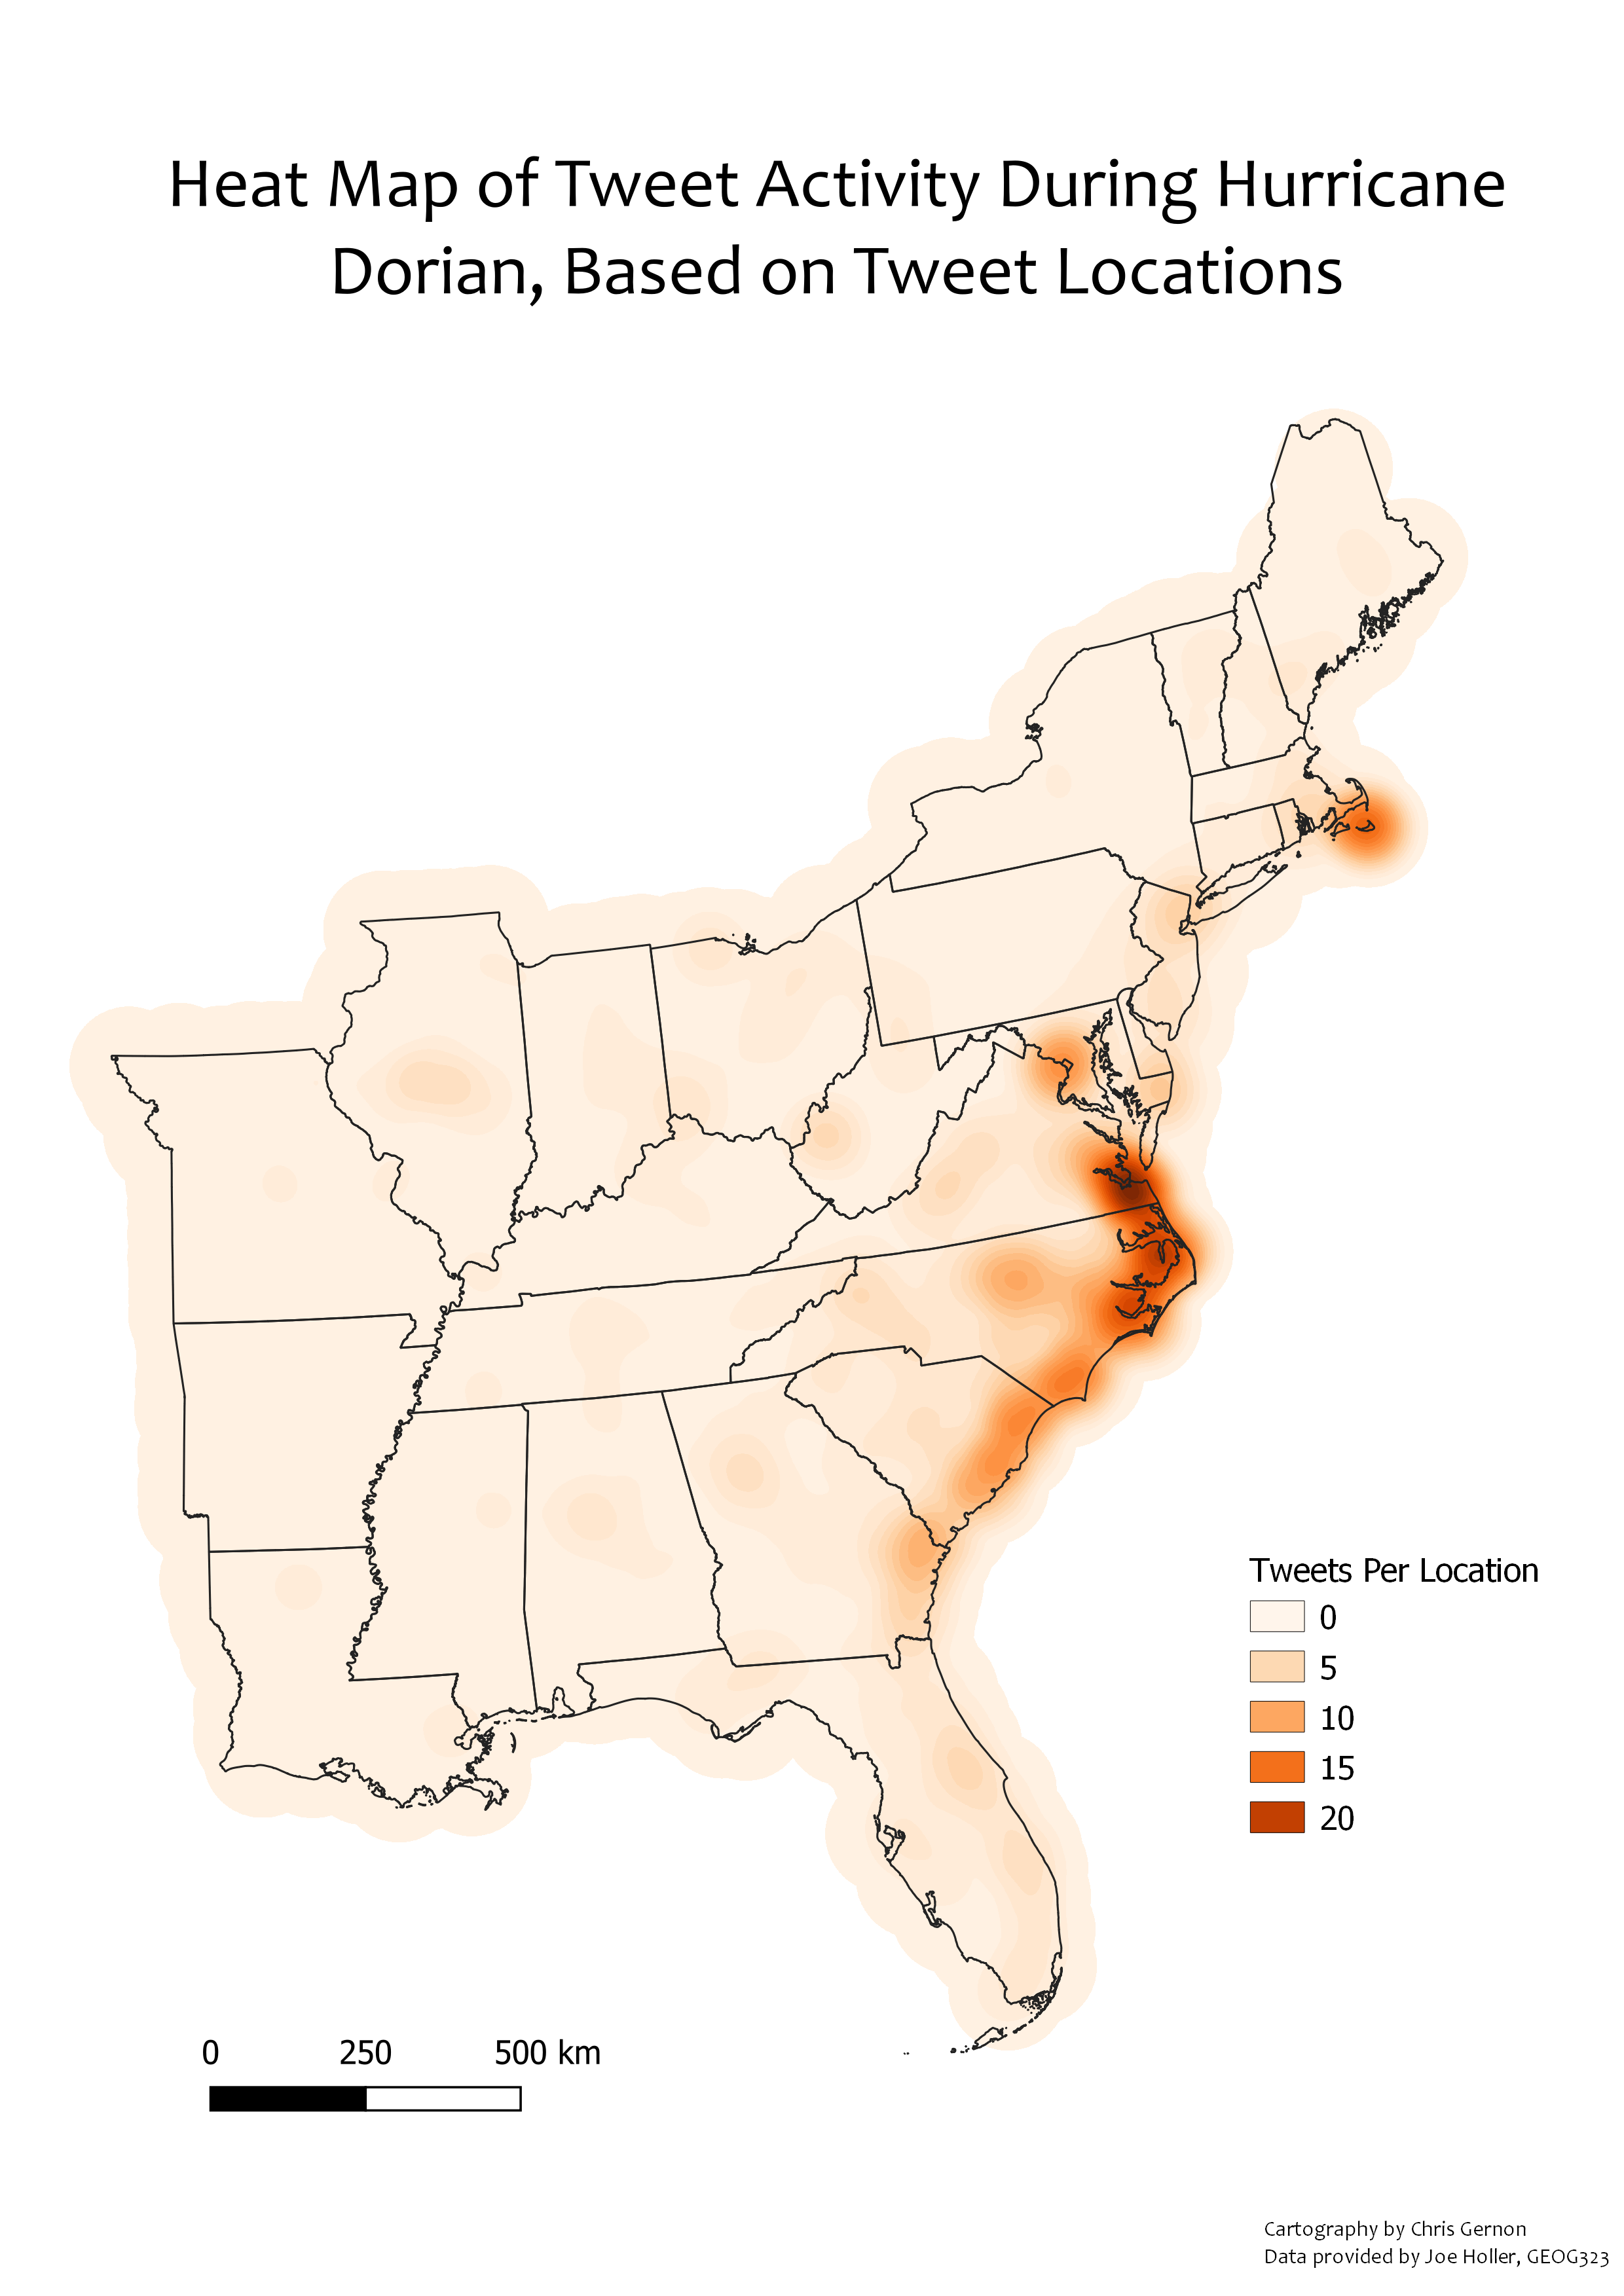
Analyzing Twitter Activity during hurrican Dorian
I was interested in seeing how hurricane Dorian impacted tweet activity for those in the path of the storm. I scraped twitter data containing geographic data using R. I used GeoDA to analyze the geographic clustering of tweets and create a heatmap that visualized the results. I found there was an increase in tweeting in those counties that were in the path of the storm.
GEOG 323, Fall 2019
Computer Skills used: SQL, GeoDA, QGIS, DB Manager, R
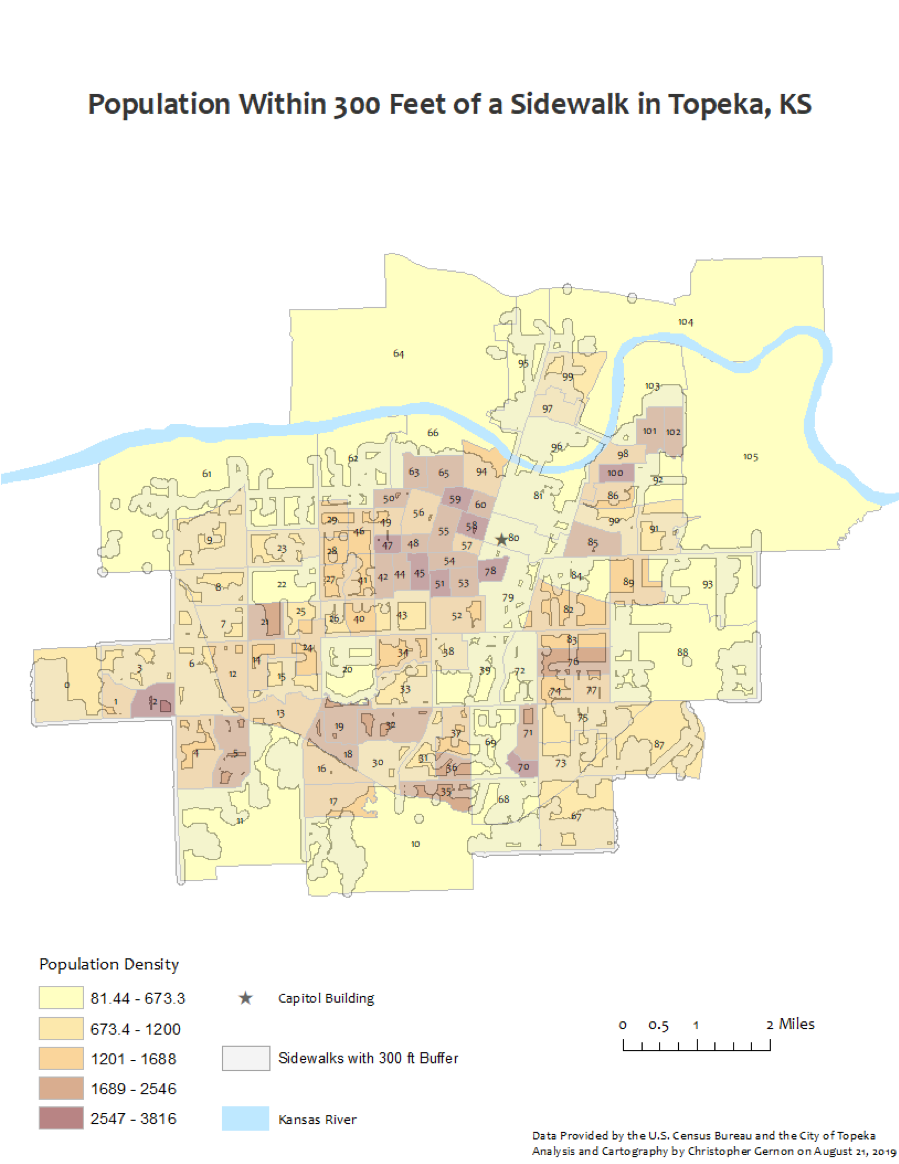
Where should Topeka, KS direct future sidewalk investment?
As a GIS intern for the City of Topeka, I was given two tasks: (1) determine how current pedestrian infrastructure was meeting pedestrian demand (2) determine where future investment in pedestrian infrastructure should take place. Using Google maps and ArcGIS Pro, I performed a multi-criteria analysis based on population density, sidewalk density, and points of interest. Using these variables, I assigned a walkability score to each census block group in Topeka. From there, I used Google Maps imagery satellite to further analyze each block group to determine reasons why an area may have received a high or low score. For example, block group 77 received a low walkability score because the cities train yard is located there. My report concludes with several recommendations that included concentrating future pedestrian investment in specific parts of Eastern Topeka. Please read the full report here.
City of Topeka Planning and Developemt Division, August 2019
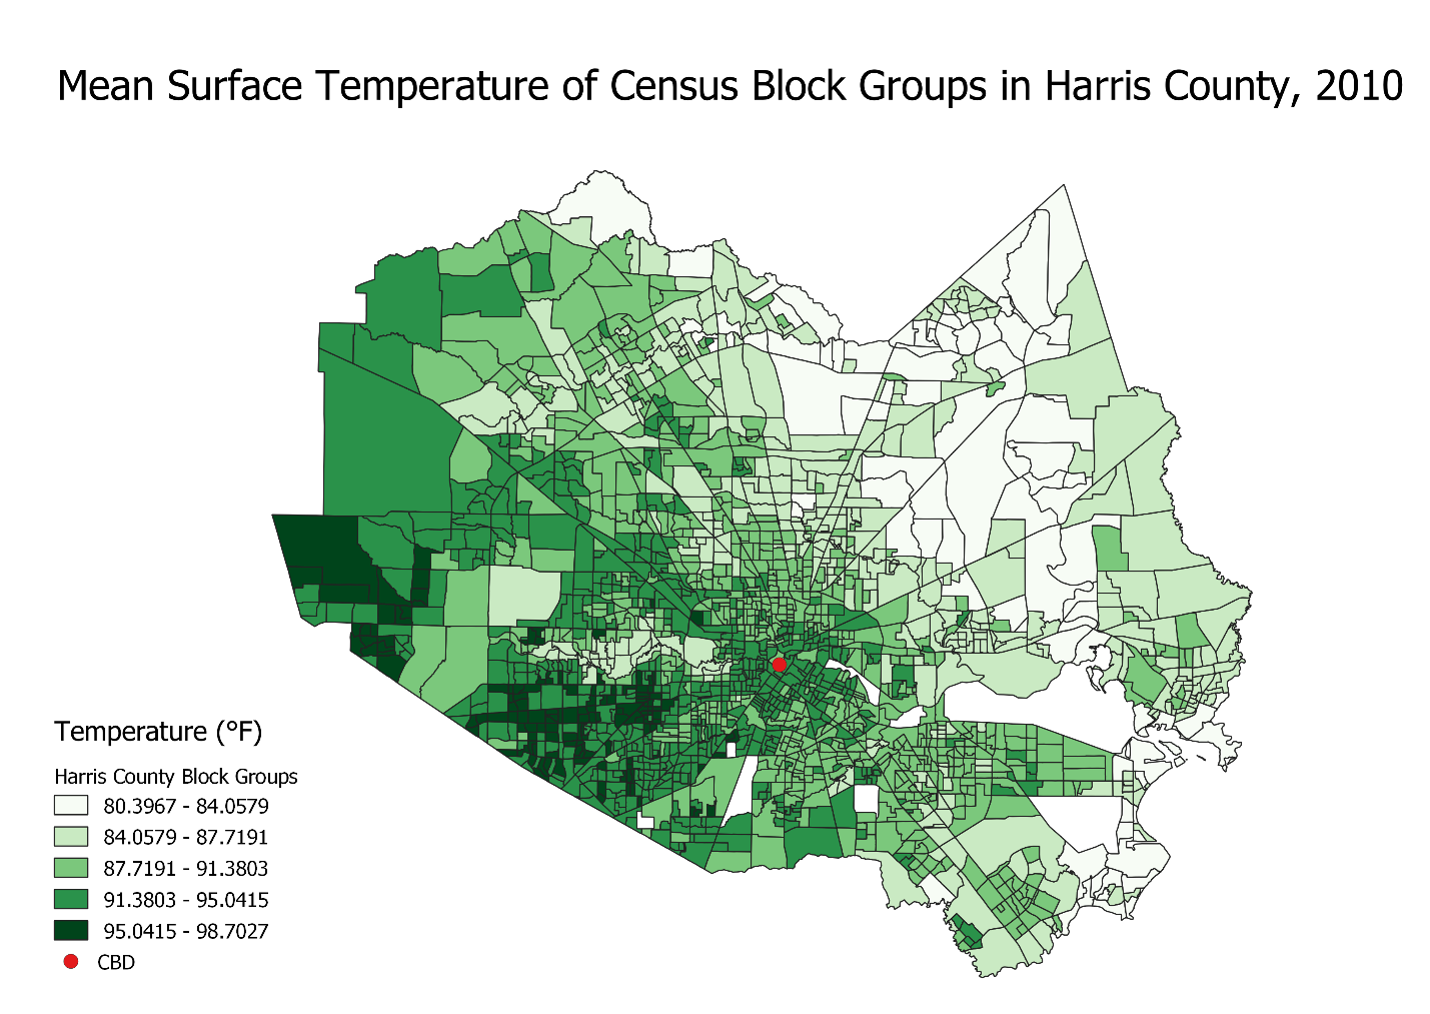
Do urban heat islands disproportionally affect minority groups in Harris County?
Using surface temperature data and census data, I analyzed heat islands and urban segregation in Harris County to determine the extent to which heat islands disproportionally impact minority groups. Click here for the full report.
GEOG 323, Fall 2019
Computer skills used: SQL, Batchscript processing, PostGIS, , OSM2PGSQL, Leaflet, Javascript, QGIS, Open Street Map